Description
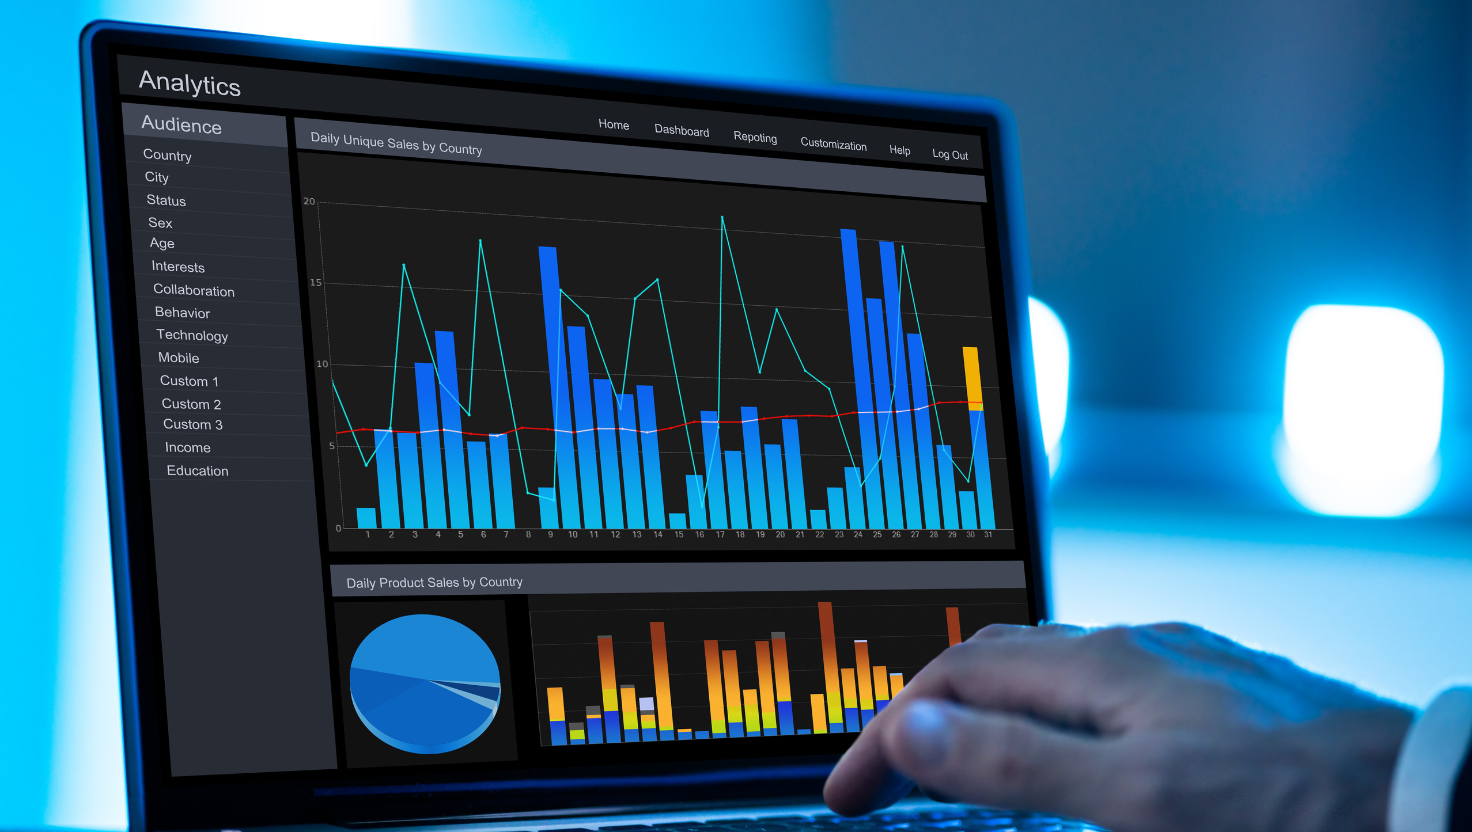
Our AI-Powered Data Visualization solutions transform complex data sets into clear, interactive dashboards and reports. We use Tableau, Power BI, and custom AI-driven tools to create intuitive charts, graphs, and infographics that help stakeholders spot trends, track KPIs, and make faster business decisions. By automating data interpretation, we make it easier for businesses to identify opportunities, reduce risks, and enhance operational performance.


Mark –
“Our team’s understanding of complex datasets has drastically improved since we started using AI-Powered Data Visualization. The platform is incredibly intuitive, allowing us to generate clear and insightful visualizations in minutes, saving us countless hours of manual analysis. It has truly transformed how we approach data-driven decision-making.”
Yetunde –
“The insights we’ve gained since implementing AI-Powered Data Visualization have been invaluable. Our team can now easily understand complex datasets and make informed decisions quickly. The platform is intuitive and the support team is incredibly responsive, making the whole process smooth and efficient. It’s transformed how we interpret data and driven significant improvements across the board.”
Emeka –
“Our team was struggling to make sense of complex datasets, spending countless hours trying to identify trends and insights. Since implementing AI-Powered Data Visualization, we’ve been able to unlock valuable information hidden within our data. The platform is intuitive, the visualizations are clear and impactful, and the support team has been incredibly responsive. It has streamlined our reporting process significantly and empowered us to make data-driven decisions with confidence.”
Anita –
“The insights we’ve gained from our data since using AI-Powered Data Visualization are incredible. It’s so easy to understand complex information now, and the visualizations have helped us make much smarter decisions. The platform is intuitive, and the support team is responsive and helpful. It has significantly improved our data analysis workflow.”
Rabiatu –
“Previously, understanding our complex data was a real challenge, but AI-Powered Data Visualization transformed everything. The platform is user-friendly and the visualizations are clear and actionable. It has significantly improved our decision-making process and we are extremely satisfied with the results.”